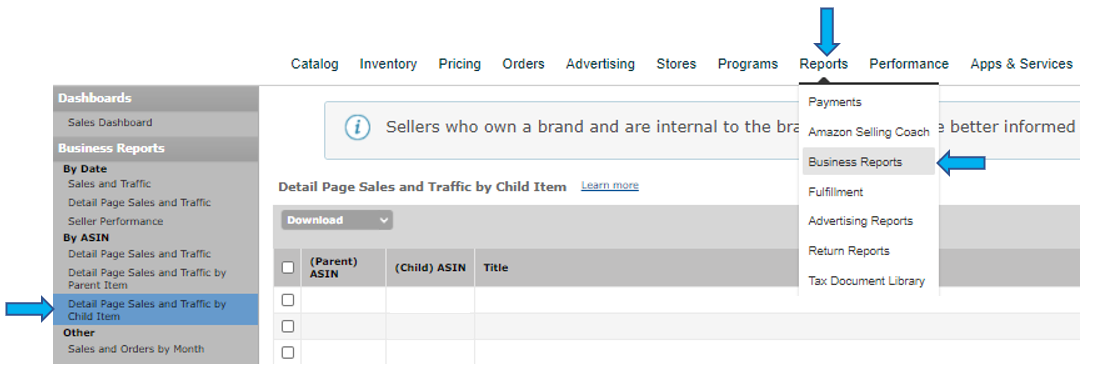
Where is the best place to check your performance on Amazon Seller Central?
One of the best reports Amazon provides Sellers for understanding their business performance comes in the ‘Detail Page Sales and Traffic by Child Item’ report.
It is not without its limitations, namely that you cannot view your ASIN level data in time series format, but considering it includes fields such as Ordered Product Sales (OPS), Conversion Rates (Unit Session Percentage and Order Item Session Percentage), Buy Box Percentage and Sessions… there is no better report for diagnosing what is driving changes in your business performance.
In fact, this is the report we use in our ‘Bridge Analysis’ to calculate the ‘drivers of change’, which help us zero-in on growth opportunities for Brands and separate the ‘signal’ from the ‘noise’.
But one thing I could never reconcile was how Amazon was calculating OPS for this report. If you have ever tried to compare the total OPS for the ‘by ASIN’ Business Reports against the ‘by Date’ Business Reports, you may have seen the issue yourself. By Amazon’s definition, Ordered Product Sales is “calculated by multiplying the price of order items and the number of units sold for the selected time period.” But if you compare the ‘OPS per Unit’ against your Amazon listing price, more often than not you’ll see that those two don’t tie either (for example, OPS per Unit equals $25.55 but your Amazon listing price is $24.99, what gives?).
Having spent years working with Amazon data, their documentation, and the various APIs, I have come to expect a certain amount of squishiness and lack of precision from them as they attempt to accommodate rapidly changing and evolving data points and definitions. When things don’t make sense, or the documentation seems out of date, my conciliatory refrain is “It’s Amazon.”
These last few months we have been integrating the Marketplace Web Services (MWS) API data for Amazon Seller Central accounts into our DATA STUDIO solution, and through the tedious process of data validation… I have finally gotten to the bottom of the question, “How do I reconcile Amazon Ordered Product Sales across the Business Reports”.
First, let’s level set:
Where is the Detail Page Sales and Traffic Report?
Where Exactly is the Ordered Product Sale Discrepancy for Platform vs. Child ASIN Sales?
As OPS = SUM(Item Price * Units Ordered), if you take the ‘Ordered Product Sales’ for an ASIN and divide it by the ‘Units Ordered’, you’ll get OPS per Unit, which by definition should equate to ‘Item Price’. But checking ‘Item Price’ against your actual Amazon listing price, you’ll see that OPS per Unit (or ‘Item Price’) can be overstated, usually in the range of ~2-4 percent. Per the example mentioned above, your OPS per Unit will be something like $25.55 while your Amazon listing price is $24.99, a difference of $0.56 or a 2.2% difference.
So, either we have a data disconnect between Amazon’s reporting of ‘Units Ordered’ and ‘Ordered Product Sales’, or Amazon has incorrectly defined or labeled the field ‘Item Price’. Teaser, it’s the latter; Amazon has incorrectly defined ‘Item Price’ for this report.
How Do I Then Reconcile Child Item Sales to Total Platform Sales?
The best way to get a ‘true’ accounting of Ordered Product Sales, in total or by ASIN, is by leveraging MWS API data. It is also possible to perform a similar analysis by exporting the raw orders data out of Amazon Seller Central, but not one I’d recommend as you have to manually pull 30 days’ worth of data at a time…we’re all for streamlining that process, which is why we are working on providing MWS data via a database for our customers, no manual report pulling required.
For some time now we have been delivering streamlined access to Amazon Advertising Data via stand-alone databases. Leveraging the Advertising API data has brought many benefits including time saved pulling manual reports, easy connection to most reporting platforms, and scaling Amazon reporting for internal teams and external clients. Now that we have begun incorporating MWS data, we are seeing similar benefits… and new possibilities.
Among many other data elements, MWS delivers Amazon order information at an ASIN and day level. Each ASIN ordered is tied to an Amazon Order ID, with all of the customer fees broken out. Included in those fees are ‘Item Price’, which indeed matches the Amazon list price, but also included are: ‘Item Tax’, ‘Shipping Price’, ‘Shipping Tax’, ‘Gift Wrap Price’, ‘Gift Wrap Tax’, ‘Item Promotion Discount’, and ‘Ship Promotion Discount’.
As part of our Amazon data validation, we mapped MWS data to the Business Reports to ensure we could replicate and automate these reports going forward. Through that process we discovered that ‘Item Price’ in the ‘Detail Page Sales and Traffic by Child Item’ report is actually calculated as ‘Item Price’ + ’Item Tax’, whereas the ‘Detail Page Sales and Traffic’ report calculates OPS using only ‘Item Price’. The ‘why’ on this I’ll explain as ‘It’s Amazon’… but it is probably a legacy definition from before they were collecting sales tax.
If you’ve ever been called upon to explain this discrepancy, you now have the most important disconnect. (I’ll save the other edge cases for another time.) But beyond this one use-case, there are other practical applications for tracking your MWS orders data in conjunction with your Business Reports. First and foremost, Promotional discounts are not being netted out of your OPS in the ‘Detail Page Sales and Traffic’ Business Reports. This can lead to surprises in your Amazon payments, as well as distort your conversion rates as price moves and price elasticity aren’t fully transparent in the business reports.
Why Should You Care About Capturing MWS Orders Data on Amazon Seller Central?
All in all, there is much to be gained by taking control of your MWS data, well beyond answering the irksome question of data consistency across reports.


Checking this