This article was written by MixShift’s Co-Founder Todd Vanderstelt, a former Amazonian who built the Hands Off the Wheel initiative to automate Amazon’s demand forecasting during his time at headquarters.
Want the Forecasting template? Get it here: https://mixshift.io/amazon-forecasting-shift/
Part 1: The Problem & Building the Model
The idea for the Forecasting App didn’t come from a whiteboard, it came from frustration. For years, I watched brands and agencies make gut calls on ad budgets and sales goals, knowing that both sides were guessing. Forecasting in ecommerce, especially on Amazon, has always been an exercise in compromise; too simple to be useful, or too complex to be trusted. I wanted to replace that guesswork with math that was simple, explainable, and powerful.
One of the brands I was advising at the time asked a seemingly simple question: “What would happen to our revenue if we reduced our TACOS target by two points?” I gave them an off-the-cuff estimate based on Sales and TACOS relationships, but that moment stuck with me. There had to be a better, more mathematically sound way to answer it.
I started by testing the correlation between Revenue and TACOS, but quickly ran into endogeneity problems. So, I flipped it on its head. Rather than modeling TACOS as the dependent variable, I decided to predict Revenue directly through multiple regression. The challenge became identifying the right inputs and model structure that would yield both accuracy and interpretability.
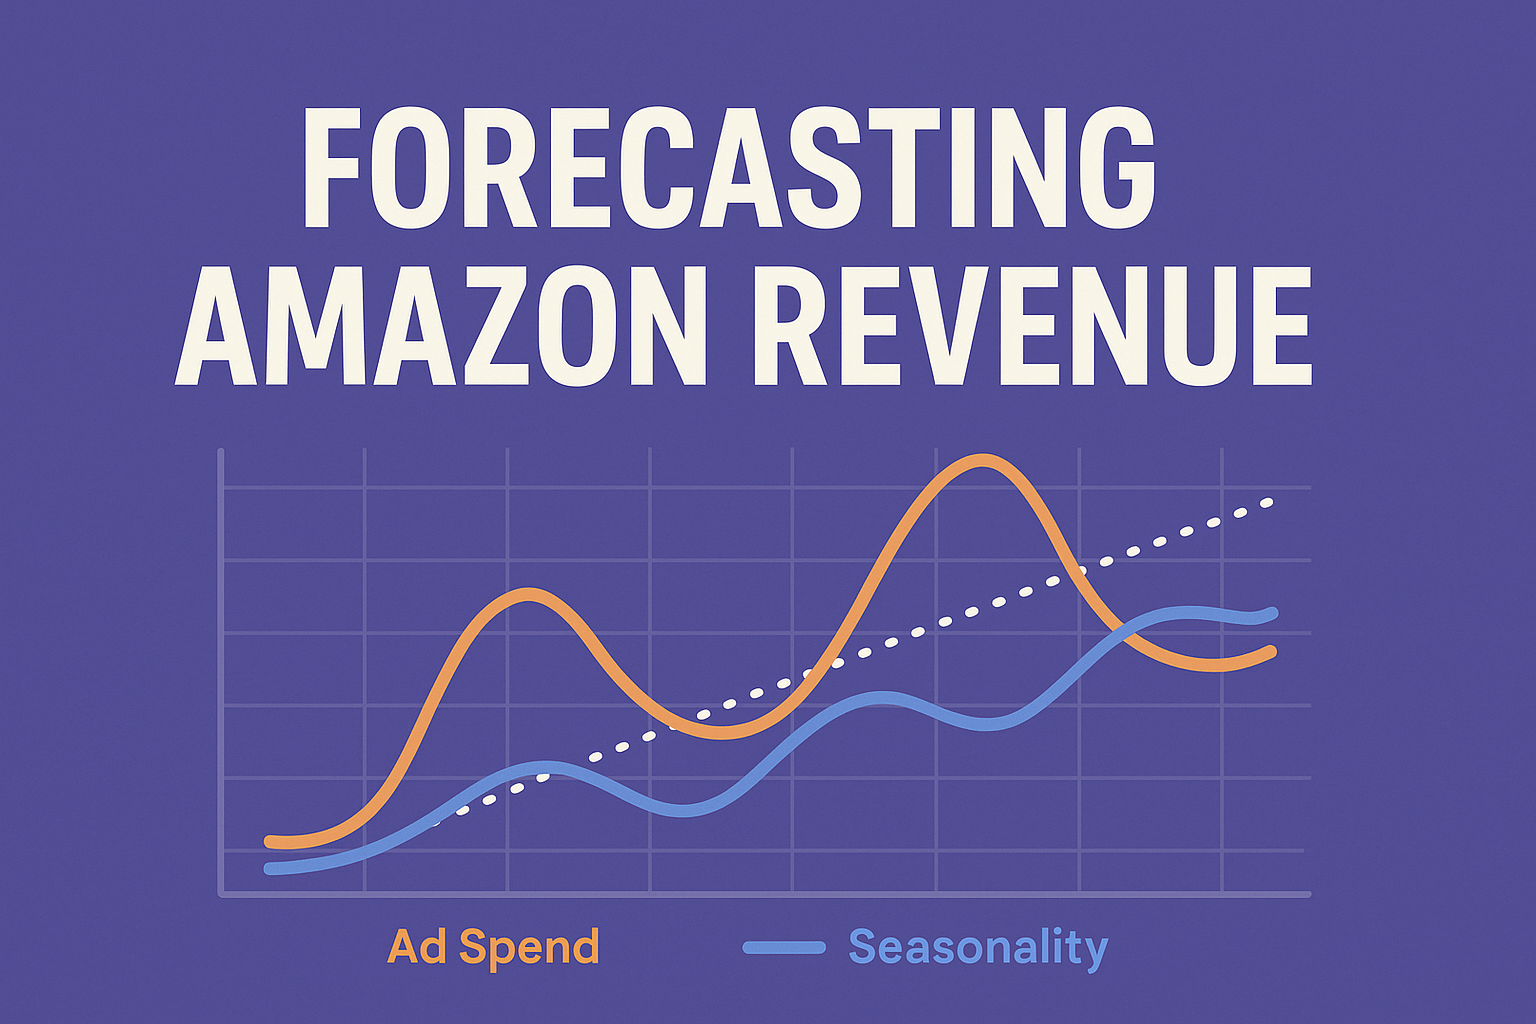
Over several iterations, I tested a range of variables: Impressions, Traffic, Clicks, Conversion Rate, Ad Conversion Rate, Spend, Time, and month dummies to capture seasonality. Complexity brought multicollinearity, so I simplified. The most stable and explainable configuration emerged from three core predictors: Spend, Trend (Time), and Seasonality.
I experimented with time grains (weeks vs. months), modeled time offsets, and even tested logarithmic and quadratic regressions to capture diminishing returns. But again, simplicity won out. The monthly multiple linear regression, grounded in those three inputs, proved both practical and robust, accurately modeling “normal” adjustments without overfitting.
After testing across multiple brands, I was confident in the model fit, coefficients, and standard errors. I translated the regression outputs into a user-friendly Excel model where a brand could input its ad budget and instantly forecast expected sales. It not only projected sales by month but also recalculated TACOS dynamically and could goal-seek the ad spend needed to achieve a desired TACOS reduction. After much Excel wizardry, it worked, and it worked shockingly well.
That prototype became the foundation for MixShift’s first forecasting tool: the “Revenue Forecasting Shift”. From there, new use cases kept emerging. The model could power an annual budget planner, allowing brands to forecast sales based on planned budgets, or flip the equation entirely, calculating the required ad spend to achieve target sales. For the first time, budget planning became data-driven rather than gut-driven.
With real-world testing, I began enhancing the model further; tracking forecast accuracy vs. actuals, visualizing YoY trends, calculating upper/lower bounds, and publishing coefficients with their margin of error. The app also visualized seasonality and showed “Sales Building Blocks,” helping users see how Spend, Trend, and Seasonality combine to form their total sales projection.
Soon, beta users were revealing even more applications I hadn’t considered. These became the backbone of the Forecasting App’s value:
Key Use Cases
Anchoring Performance
The forecast sets a baseline: “Here’s what should happen if history repeats itself.” Beating the forecast signals something extraordinary; maybe a promotion, press coverage, or competitor stumble. Missing it? That’s a defect worth investigating. Either way, the model exposes outliers that MoM or YoY trends can’t.
Building Trust Through Accuracy
Forecast skepticism is natural. That’s why the app lets users compare past forecasts to actuals. Seeing month-by-month accuracy builds confidence that this isn’t just theory, it’s reality.
Justifying Mid-Month Budget Increases
When pacing hot mid-month, the Forecasting App arms you with math, not hunches. It quantifies the incremental sales from additional ad spend, giving you a defensible case to unlock budget. No more “trust me”, it’s “Here’s the forecasted return.”
Understanding Model Fit and Drivers
If the model fit is low, you know outside forces are at play; viral TikToks, stockouts, or supply disruptions. If it’s high, you know spend, time, and seasonality are driving results. The model becomes an X-ray for your business.
Exposing the Ad Coefficient
This metric reveals how much total sales, not just ad-attributed sales, each extra ad dollar delivers. It exposes true incrementality, giving advertisers a clear picture of ad impact on the business as a whole.
Optimizing Investment Across Markets and Channels
See where ad dollars stretch furthest, whether across countries, channels, or marketplaces. The model helps users identify opportunities to reallocate spend toward the highest-efficiency markets.
Tracking Market Saturation
Markets change. What worked yesterday might not work tomorrow. By tracking how your ad coefficient evolves over time, you can spot saturation points. If you’re pressing hard on ads but not hitting your forecast, or if coefficients are trending downward after sustained spend, that’s the model’s way of saying: “Returns are degrading.” That’s your cue to rethink strategy before wasting dollars.
Balancing TACOS Targets
Cutting spend blindly can backfire. The model lets you simulate lower TACOS scenarios and quantify their sales impact, turning cost cuts into informed trade-offs.
Measuring Promotions
Promos often distort historical patterns. Comparing actuals vs. forecast isolates the true lift from a promotion, making marketing success measurable.
Visualizing Seasonality
The app’s seasonal curves expose timing and amplitude of peaks and valleys, helping brands time spend with precision.
Telling the Story with Visuals
Executives understand visuals. The app’s “building blocks” chart shows how baseline, trend, seasonality, and spend stack to form sales, transforming complexity into clarity.
Planning Next Year’s Budget
The model flips the question: “Here’s our growth target… how much ad spend will it take to hit it?” If leadership won’t approve that, the math defines the shortfall and refocuses the discussion toward “what strategic moves (promos, launches, expansions) would be needed to close it”.
Allocating Budgets by Month
Seasonality plus historical efficiency guide monthly allocations, ensuring dollars go where returns are highest.
Scenario Planning
Model High, Medium, and Low cases to visualize the range of outcomes and associated risks.
Inventory and PO Alignment
Sales forecasts don’t live in isolation. They translate directly into units, which in turn dictate purchase orders. By tying OPS forecasts into your supply chain planning, you can cut POs with more confidence, avoiding both costly overstocks and revenue-draining stockouts.
ROI and Payback Analysis
By applying margin assumptions, the app projects ROI and payback periods, turning ad spend debates into investment discussions.
Benchmarking Brands and Regions
Compare regions or sub-brands side by side to identify efficiency gaps and growth opportunities.
Detecting Competitive Pressure
Unexpected misses can signal competitor action. Over time, these patterns become a real-time warning system.
Evaluating New Launches
Measure incremental lift from new products by comparing launch performance to the baseline forecast, quantifying success beyond intuition.
Executive Storytelling
The model helps users translate complex data into clear narratives for boardrooms, budget asks, and strategic sessions. Math meets storytelling.
These were only the start. In future phases, I’ll focus on refining the model for brands with high repeat-purchase behavior, where ad spend’s full value isn’t immediately visible. In these cases, new customers acquired through ads return 30–60 days later, but that delayed revenue gets misattributed to the trend coefficient. I’m currently experimenting with bias adjustments such as testing at coefficient standard deviations and reworking the model structure to better capture this delayed incrementality.
Looking ahead, the same regression-based logic is powering a Unit Forecasting model, where revenue projections cascade into item-level forecasts for PO planning. This approach is proving more stable and accurate than traditional bottoms-up methods, laying the groundwork for MixShift’s next generation of real-time forecasting tools.
Part 2: Why I’m Qualified to Solve It
Forecasting has been a core part of my career across finance, operations, and strategy. Some of it was manual, supporting production or capital planning. Other times it was strategic, helping determine hiring plans, resource allocation, and long-range growth. Across all of it, I learned that forecasting only works when it blends analytical rigor with practical understanding. Most teams fail because they treat it as one or the other.
My foundation was built at Amazon, where forecasting wasn’t an academic exercise. It dictated how businesses planned, priced, and invested. As COO of Amazon’s Textbook division, and later as Head of the Hands-off-the-Wheel initiative, I helped design forecasting systems that shaped how Amazon managed demand, inventory, and profitability across categories. That experience taught me what most models get wrong: accuracy on paper doesn’t matter if it doesn’t lead to the right business decision.
After Amazon, I founded and led two Amazon Marketplace Services agencies, working directly with hundreds of brands. I saw the same pattern play out repeatedly. Forecasting tools were either too simplistic to be trusted or too complex to be usable. They missed how ad spend, seasonality, and trend actually interact in real life. That gap between what’s mathematically elegant and what’s operationally useful is exactly what I set out to close.
Where Other Forecasting Solutions Fail
- Bottoms-Up Overconfidence
Most forecasting platforms for Amazon sellers and vendors take a bottoms-up approach, modeling every SKU individually and then aggregating the results. On paper, that looks precise. In practice, it multiplies error. Small inaccuracies at the SKU level compound as they roll up, producing totals that appear statistically valid but miss the mark in real-world performance. The result is volatile forecasts with wide confidence intervals and poor month-to-month stability. A single product misforecast can swing the entire category, masking what’s really happening.
The top-down approach avoids that trap. By modeling at the aggregate level, (where variability naturally smooths) it delivers tighter confidence intervals, greater forecast consistency, and faster adaptation to new trends. It captures the underlying signal instead of the noise, making it far more actionable for planning and budgeting. Brands and agencies feel the difference immediately: the forecast tracks with reality instead of fighting it.
- Complexity Without Clarity
Many vendors rely on machine-learning or Marketing Mix Model (MMM) frameworks that simulate performance based on massive datasets and thousands of parameter runs. Amazon’s own DSP and attribution systems work the same way; highly sophisticated, but completely opaque. Advertisers are told, “Here’s your estimated lift,” without any visibility into how it was calculated. There’s no clear relationship between spend and outcome, just an inferred benefit you’re asked to trust.
The Forecasting App takes the opposite approach. It makes the Ad Coefficient visible, quantifying exactly how much total sales each advertising dollar drives, and showing how that relationship evolves over time. It’s transparent, auditable, and grounded in the brand’s own data; no hidden assumptions, no “black box.”
- Disconnected from Marketing Reality
Traditional forecasting tools focus on units and revenue but treat advertising as external noise. Ad-tech platforms do the opposite; they optimize for ad efficiency while ignoring seasonality, pricing, and product lifecycle. The result is two disconnected worlds: financial planners model demand without accounting for the spend that drives it, and marketers model spend without visibility into the downstream sales impact. The data lives in silos, the timelines don’t align, and the KPIs compete instead of connect.
The Forecasting App closes that gap by linking ad spend directly to total sales through a single, transparent model. It recognizes that advertising isn’t a separate lever; it’s one of the primary drivers of demand. By uniting marketing inputs with business outcomes, it creates a shared baseline for finance, operations, and marketing to plan from. For the first time, everyone is working from the same forecast instead of three different versions of the truth.
- Unsustainable to Maintain
Most forecasting systems demand constant retraining, data normalization, and SKU-level cleanup just to stay functional. They rely on machine learning models that decay quickly when new products launch or when the data feed changes, forcing users to restart the process again and again. That level of upkeep might make sense for a Fortune 100 analytics team, but it’s completely unrealistic for the typical brand or agency that needs answers, not algorithms. The result is predictable: the tool gets abandoned, the spreadsheet returns, and forecasting slips back into guesswork.
The Forecasting App is built to avoid that trap. It runs on data every seller and vendor already has, revenue and ad spend, and updates automatically as new months close and are added to the model. There’s no model retraining, no manual rework, and no dependency on complex data pipelines. The focus stays on interpretation and action, not maintenance.
- Misaligned to Business Cadence
Brands and agencies plan annually and manage performance month by month. Yet most bottoms-up systems operate on daily or weekly data, producing forecasts that fluctuate wildly with short-term noise. Those daily and weekly performance trends may be useful for campaign optimization, but they’re impossible to translate into reliable monthly or quarterly plans. Finance teams can’t reconcile them, marketers can’t defend them, and leadership can’t act on them.
The Forecasting App is built around the same cadence that real businesses use. It models sales and spend at the monthly level, smoothing volatility while preserving the underlying trend. That alignment makes forecasts easier to communicate, easier to defend, and directly usable in annual planning, budget setting, and performance reviews. Instead of over-analyzing the daily noise, teams can finally plan around the signal that matters.
Why the Top-Down Approach Works Better
A top-down model starts where decision-makers actually live: total revenue. It works backward from that outcome, capturing the macro relationships between ad spend, trend, and seasonality, then uses those to forecast performance at the same level where goals are set and results are measured.
The advantages are clear:
Accuracy Where It Matters: Aggregated modeling reduces noise and produces tighter confidence intervals. Instead of chasing SKU-level volatility, it captures the stable performance patterns that drive overall results.
Transparent and Explainable: Every input represents something tangible; spend, time, and seasonality. Users can see exactly how each variable contributes to the forecast, making it easier to trust and adjust.
Aligned Across Teams: Finance, operations, and marketing can all plan from the same baseline. The forecast becomes a shared truth instead of a department-specific version of reality.
Quick to Deploy: It runs entirely on data every seller and vendor already has, sales history and ad spend. There’s no retraining, no specialized data pipelines, and no machine-learning overhead.
Adaptable to Change: Because it’s grounded in long-term relationships rather than short-term noise, the model stays stable through promotions, launches, and market shifts. It updates automatically as new data arrives, not through manual retraining.
This approach doesn’t aim to replace existing tools; it strengthens them. It provides a simple, auditable foundation for planning that bridges the gap between advertising and sales, turning forecasting from a black box into a shared language for decision-making.
Why My Background Matters
Most people who build forecasting tools come from one of two backgrounds. They’re either data scientists focused on operational precision or marketers focused on advertising efficiency. Both groups operate in silos. The data scientist understands variance but not the business trade-offs behind it. The marketer understands performance drivers but not how to model them mathematically.
Very few have sat in both seats. I have. I’ve built bottoms-up forecasting algorithms at scale; models that predict demand at the SKU or ASIN level with all the precision and complexity that come with them. They absolutely have their place. For replenishment or inventory allocation, bottoms-up forecasting can work extremely well. But for revenue planning, budget setting, or product-mix forecasting, that same granularity becomes a liability. It demands large amounts of stable historical data and can’t easily adjust for new product launches, end-of-life items, or capacity constraints that require human judgment.
That’s where most brands struggle. They don’t have Amazon’s scale, history, or infrastructure to maintain and blend multiple bottoms-up models capable of meeting business needs. What they need instead is a framework that’s accurate, interpretable, and flexible enough for real-world adjustments. That’s why a top-down approach succeeds where bottoms-up systems fall short; it delivers the clarity brands actually need, not just mathematical precision.
This perspective comes directly from experience. After leading forecasting and automation initiatives at Amazon, I spent years helping hundreds of brands and agencies navigate the same trade-offs. I saw that their real challenge wasn’t building a perfect algorithm; it was aligning data, judgment, and decision-making. Each team had numbers, but no shared truth.
That’s why my approach starts where they are: with the business problem, not the statistical one. It follows Amazon’s own principle of “working backward from the customer.” The goal isn’t precision for its own sake; it’s a forecasting system that helps brands plan with confidence when the future doesn’t look exactly like the past.
The Forecasting App was shaped by real scenarios: brands defending ad spend during soft periods, agencies proving performance lift, executives reconciling revenue shortfalls against investment. Every feature reflects those conversations. It connects what leadership wants to see, what marketers can influence, and what the data can reliably support.
That combination of technical depth and practical experience is rare in this space. It’s why this model works when others don’t. It blends structure with flexibility; forecasting that’s rigorous enough to trust, adaptable enough to use, and grounded in firsthand understanding of both the math and the mission.


