When you download the Amazon Forecasting Shift, you’ll receive:
✅ Free Excel Forecasting Template
- Plug in 12–25 months of sales + ad spend.
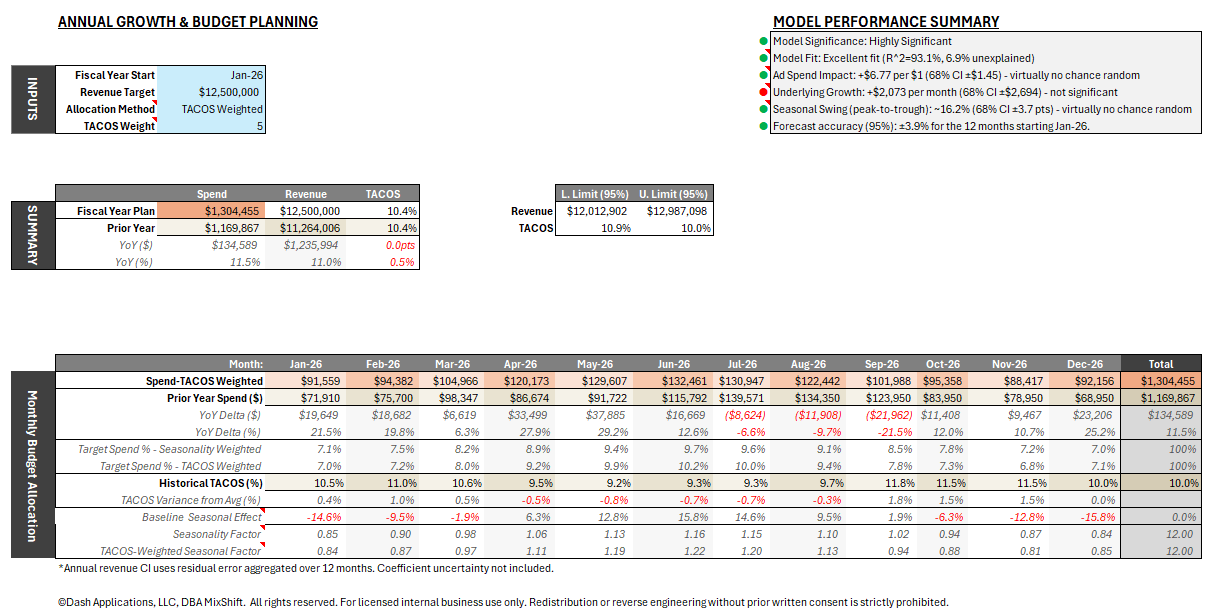
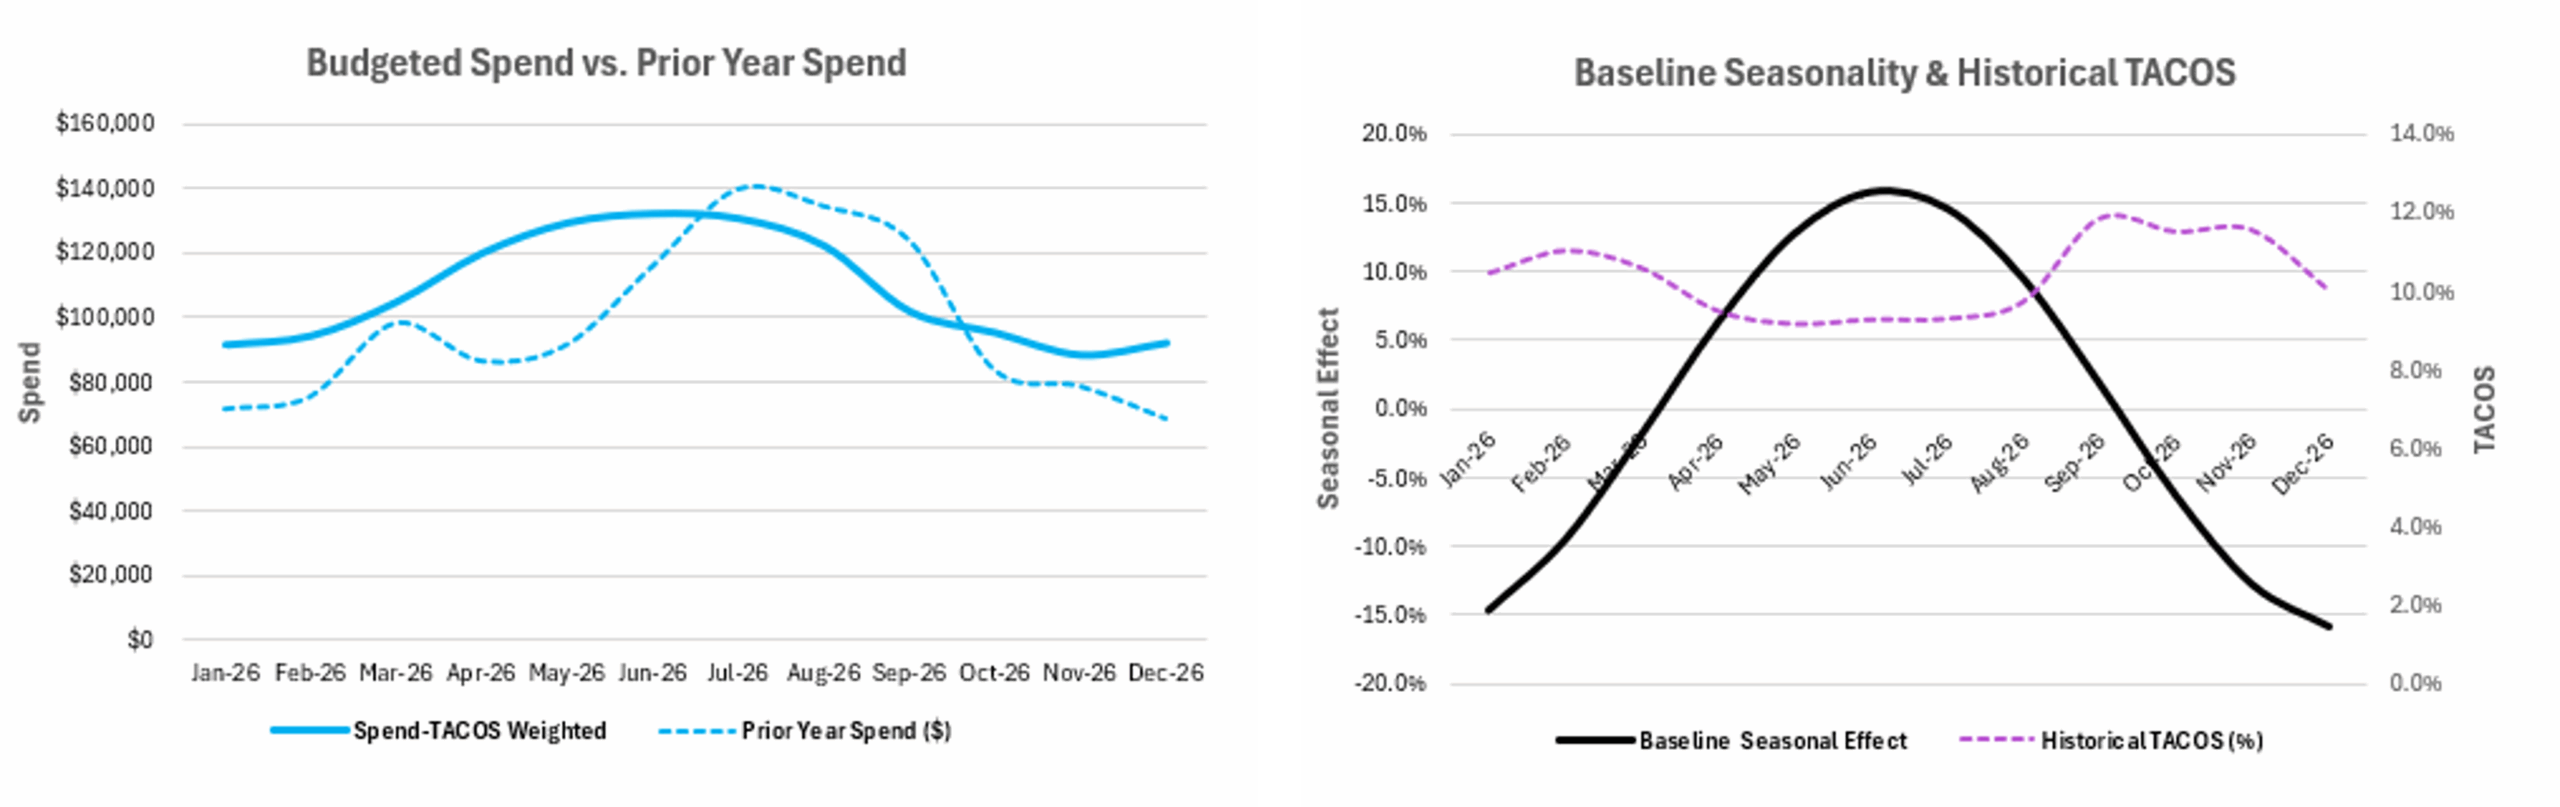
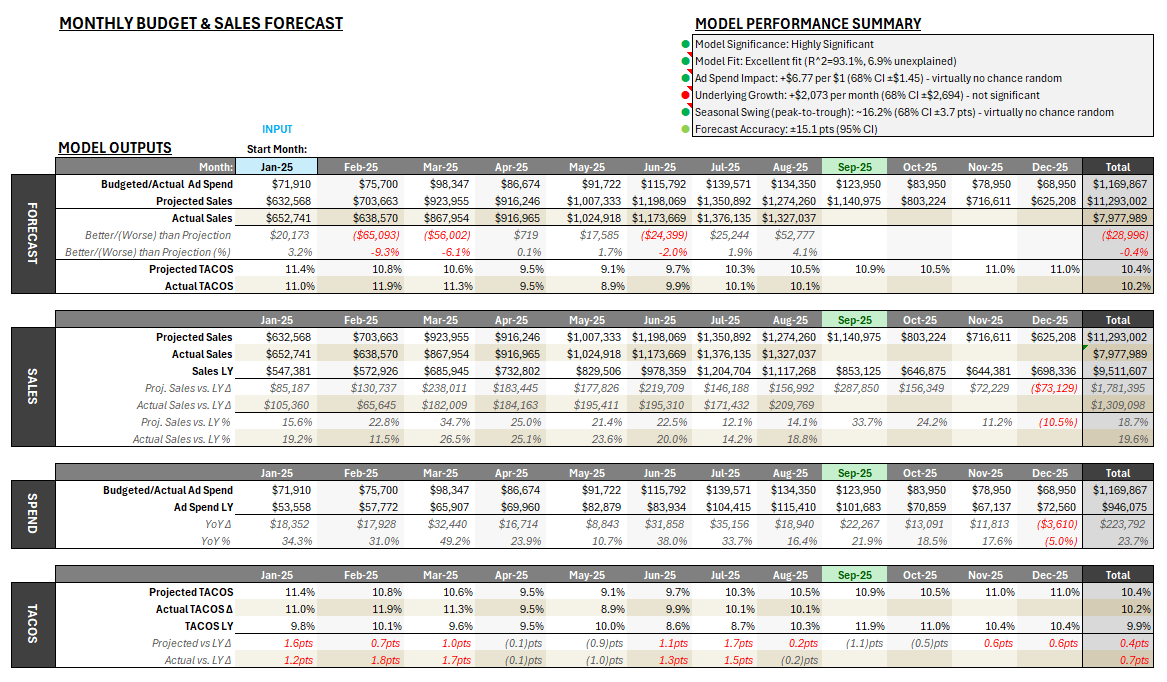
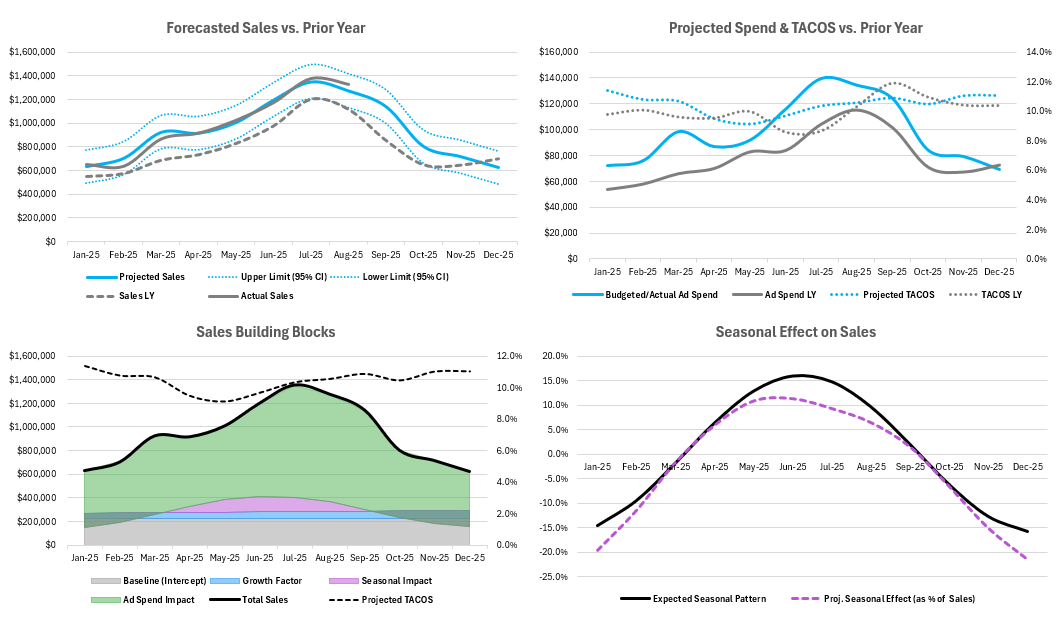
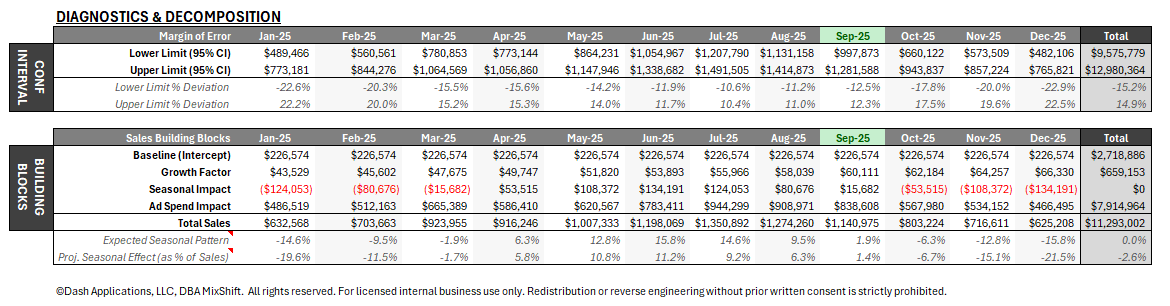
- Outputs: forecasts, coefficients, confidence intervals, actual vs forecast charts, outlier flags.
- Designed for a single brand (duplicate for more if needed).
✅ Quick-Start Guide + Sample Data
- Step-by-step instructions so you can load your data and see results in minutes.
- Sample dataset included to preview how the model works.
✅ Free Consultation Session (Optional)
- MixShift customers: 1 free walkthrough on one brand.
- Non-customers: same benefit if you book a MixShift demo.
- Session covers: data load, model fit, coefficient readout, outlier diagnosis.
✅ Optional Paid Add-Ons
- $150 / 30 min or $300 / 60 min consults.
- Bundle: 3 × 60-min sessions for $750.
- Custom ASIN-level forecast builds starting at $8K.
How It Works
- Complete the form above with your company email. We’ll send you the template right away.
- Upload your sales + ad spend history (12–25 months recommended).
- Generate your forecast with seasonality, trend, and ad elasticity built in.
- Use it as your anchor for planning, reviews, and outlier detection.
- Book a consult if you want expert walkthroughs or deeper analysis.
Case Studies using Amazon Forecasting Shift:
Case Study 1: Capitalizing on Prime Day Momentum
A brand’s advertising manager, riding a strong Prime Day, used the model to justify a 40% ad spend increase ($40K above budget). By inputting the updated spend pace, they presented a sales projection to their CEO, securing approval. The result? Actual sales hit $1.3M, within 0.5% of the model’s forecast, proving its precision in high-stakes scenarios.
Case Study 2: Profitability Across Marketplaces
A brand aiming to boost profitability before an acquisition initially cut ad spend across all marketplaces. The model revealed one market’s Advertising Coefficient was 3x higher than another, despite similar ACOS, TACOS, and customer retention metrics. This insight shifted their strategy; maintaining spend in the high-return market while cutting elsewhere, balancing sales and profitability.
Case Study 3: Setting the Right TACOS Target
Facing rising Amazon fees, a brand needed to optimize TACOS without sacrificing sales. The model projected sales volumes at varying ad spend levels, identifying which marketplaces offered the best return and which were nearing saturation. This data-driven approach guided their TACOS targets, aligning with profit goals.
Case Study 4: Measuring Promotional Impact
A brand went aggressive with Prime Day discounts, unsure of the impact due to year-over-year changes (e.g., Prime Day extending to four days). With historical accuracy within ±4%, the model underpredicted sales in July by -19%, signaling the promotion’s incremental value. This gave the marketing director a data point to quantify the campaign’s success.
How our brand and agency partners are using it:
𝐹𝑜𝑟𝑒𝑐𝑎𝑠𝑡 𝑎𝑝𝑝 𝑙𝑜𝑜𝑘𝑠 𝑰𝑵𝑺𝑨𝑵𝑬. 𝐴𝑏𝑠𝑢𝑟𝑑𝑙𝑦 𝑐𝑙𝑜𝑠𝑒 𝑡𝑜 𝑤ℎ𝑎𝑡 𝐼 ℎ𝑎𝑑 𝑏𝑢𝑖𝑙𝑡. 𝐼𝑛𝑐𝑟𝑒𝑑𝑖𝑏𝑙𝑦 𝑖𝑚𝑝𝑟𝑒𝑠𝑠𝑒𝑑. 𝐶𝑎𝑛𝑛𝑜𝑡 𝑤𝑎𝑖𝑡 𝑓𝑜𝑟 𝑡ℎ𝑒 𝑟𝑒𝑙𝑒𝑎𝑠𝑒.