If you’re an Amazon agency trying to grow, you’ve likely hit this moment:
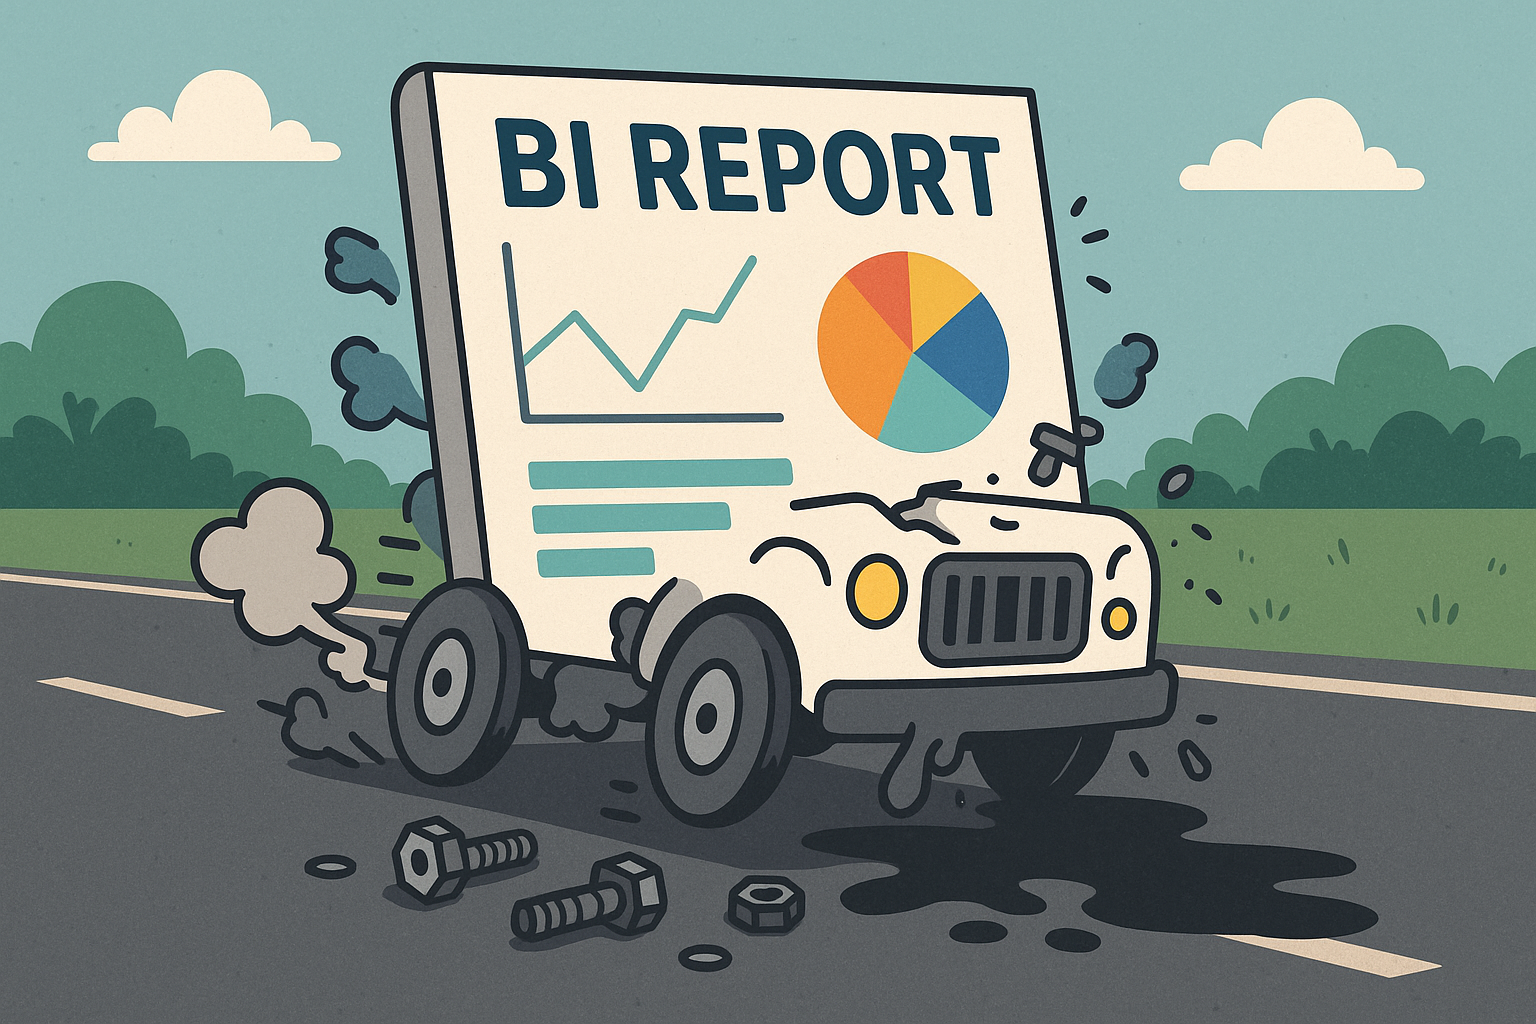
You’re onboarding new clients. You’re juggling more brands. But reporting—something you know is critical—is crumbling under the weight.
Here’s the reality: most Amazon reporting systems at early-stage agencies are built on Excel, Google Sheets, and manual downloads. They work… until they don’t.
Let’s unpack why reporting breaks at scale—and what it costs your team, your clients, and your agency’s growth.
1. Employee Burnout
As client volume increases, so does the reporting workload. More manual downloads. More pivot tables. More late nights. The work is mind-numbing. Waiting for reports to download, watching Excel crawl through massive files—it’s a recipe for burnout. Agencies often end up hiring more people just to pull and prep data instead of actually analyzing it.
2. The House of Cards
Manual systems are fragile. Amazon changes its data structures often, breaking formulas, references, and logic in your sheets. One small change—one broken column header—and your whole dashboard collapses. Rebuilding it eats hours of time.
3. No Redundancy
What happens when your “Excel wizard” takes a vacation? Or quits? Tribal knowledge isn’t a system. When your reporting is owned by one person, you’re one PTO request away from a client fire drill.
4. No Data Backups, No Recovery
Excel and Google Sheets are not databases. They can get corrupted. Files can be deleted. And Amazon’s lookback windows (e.g., 60 days for ad data) mean that once it’s gone—it’s gone. You could lose months or years of client history in a single click. You don’t want to be the agency that has to tell your client you lost all of their data.
5. It Looks Unprofessional
High-quality clients expect high-quality reporting. Excel exports won’t cut it. If your reporting doesn’t look trustworthy, it undermines your entire relationship. As you start to improve the quality of clients you are working with, you have to improve what you’re delivering.
6. Inflexibility Leads to Unanswered Questions
Want to look at a different KPI? A new product segment? In Excel, you’re rebuilding dashboards every time. You can’t adapt live during a client meeting. It kills momentum and you have to dance around the question. Manual reports can only show what you’ve already preloaded. If a client asks a question outside of that—different timeframe, different product group, different data set, different marketplace —you can’t answer it in real time. You’re stuck saying, “Let me get back to you.”
7. Stale Data
Your reports are outdated the moment you send them. Excel doesn’t auto-refresh. Clients have no access to real-time performance trends unless they email you to ask.
8. No Shareability
Manual reports are emailed attachments. There’s no link to click, no secure sharing, no multi-user access. Collaboration is clunky.
9. Data Transformations Are a Nightmare
Metrics like Customer Lifetime Value, TACoS trends, or New vs. Repeat Revenue? Nearly impossible without a database and programmatic logic. You’re stuck with brittle formulas across multiple sheets, hoping they don’t break.
10. Onboarding Is Painful
New client = new Excel monster to build. It’s a massive time suck. Time that should be spent learning the client’s goals gets eaten by downloading and formatting data.
11. Updating Is a Black Hole
Agencies spend 2–4 hours per client per month just updating reports—not analyzing, not strategizing. Multiply that by your client count and you’ll see the silent killer of agency margin.
12. Data Size & History Breaks Excel
As historical data builds, Excel slows to a crawl. Loading dashboards becomes a nail-biting experience—especially on a live client call. You shouldn’t need a backup plan for your backup plan.
13. Human Error Is Unavoidable
Wrong data. Wrong file. Wrong client. One mistake and your agency’s credibility is at risk and you are stuck writing a serious apology email. These are avoidable problems if reporting isn’t handled manually.
It’s time for better reporting.
At MixShift, we’re building a modern solution for Amazon agencies—purpose-built to eliminate manual workflows, restore trust in your data, and give you and your clients real visibility.
If you’ve ever felt any of the pain above, we’d love to invite you to join our beta for Report Center Core.
🔗 [Join the Beta]
Let’s fix reporting, together.
Sincerely,
Shifty Mix


